Monitor the Controller and cloudflared
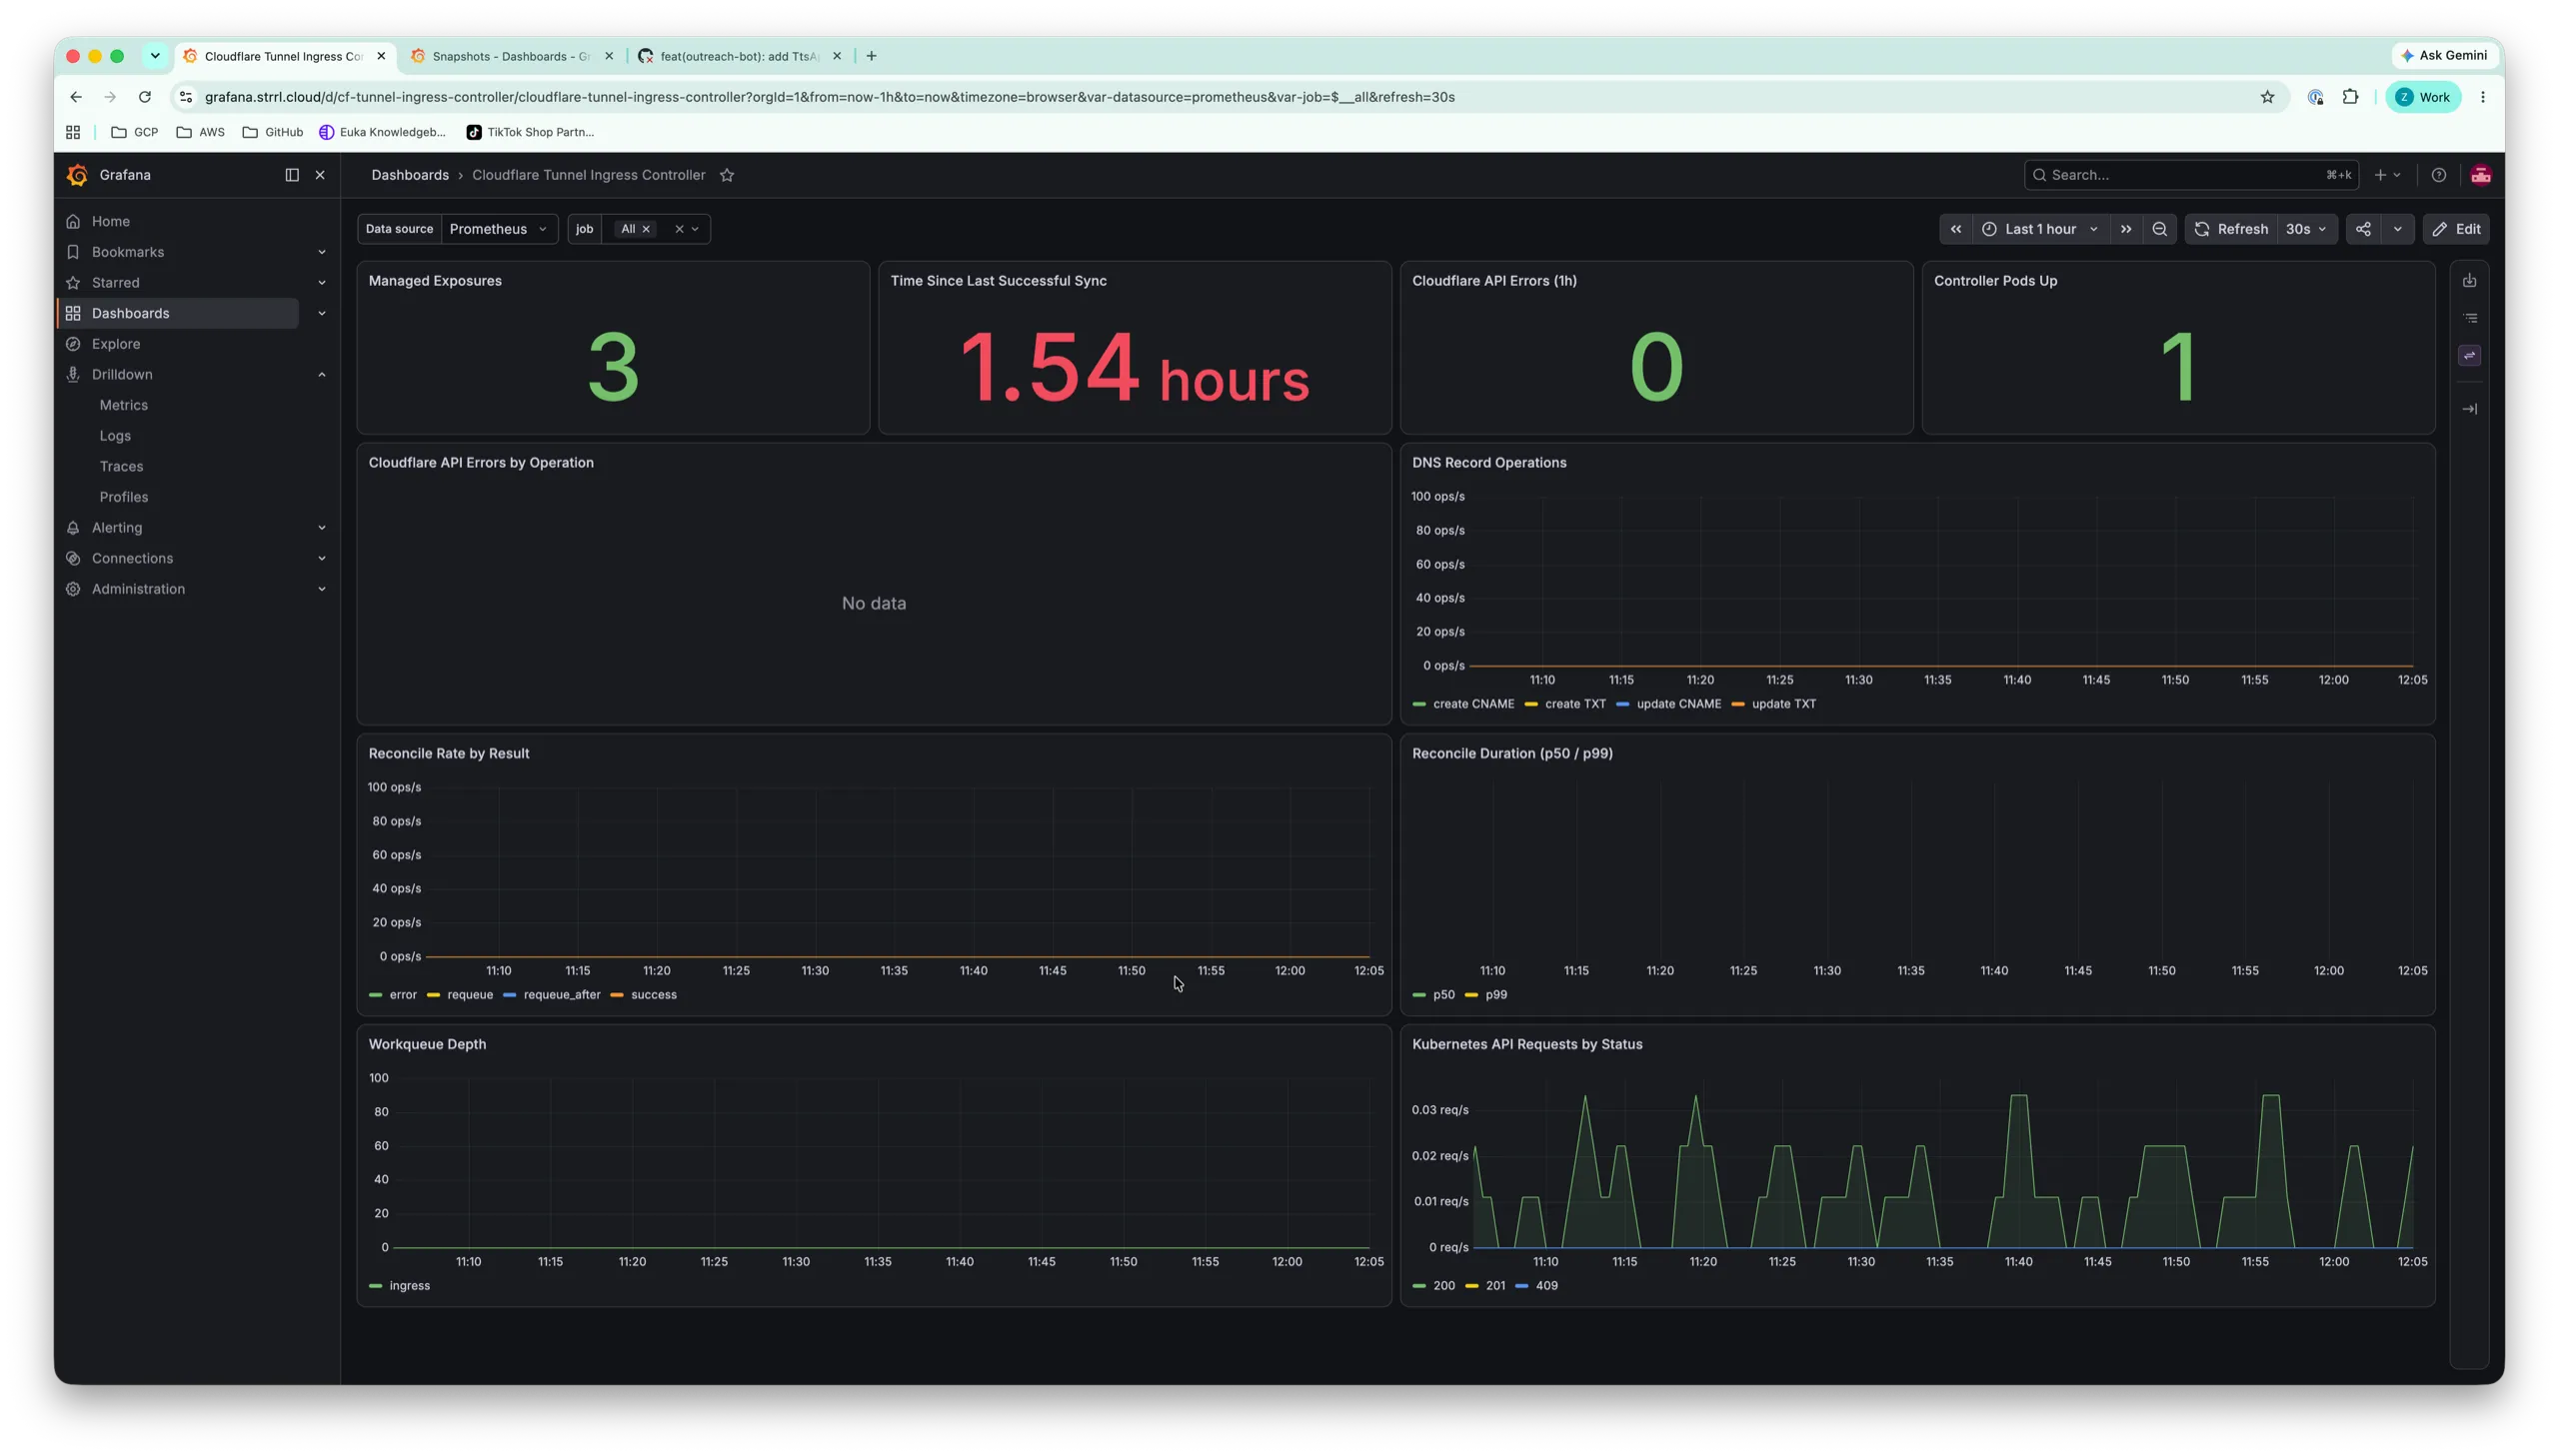
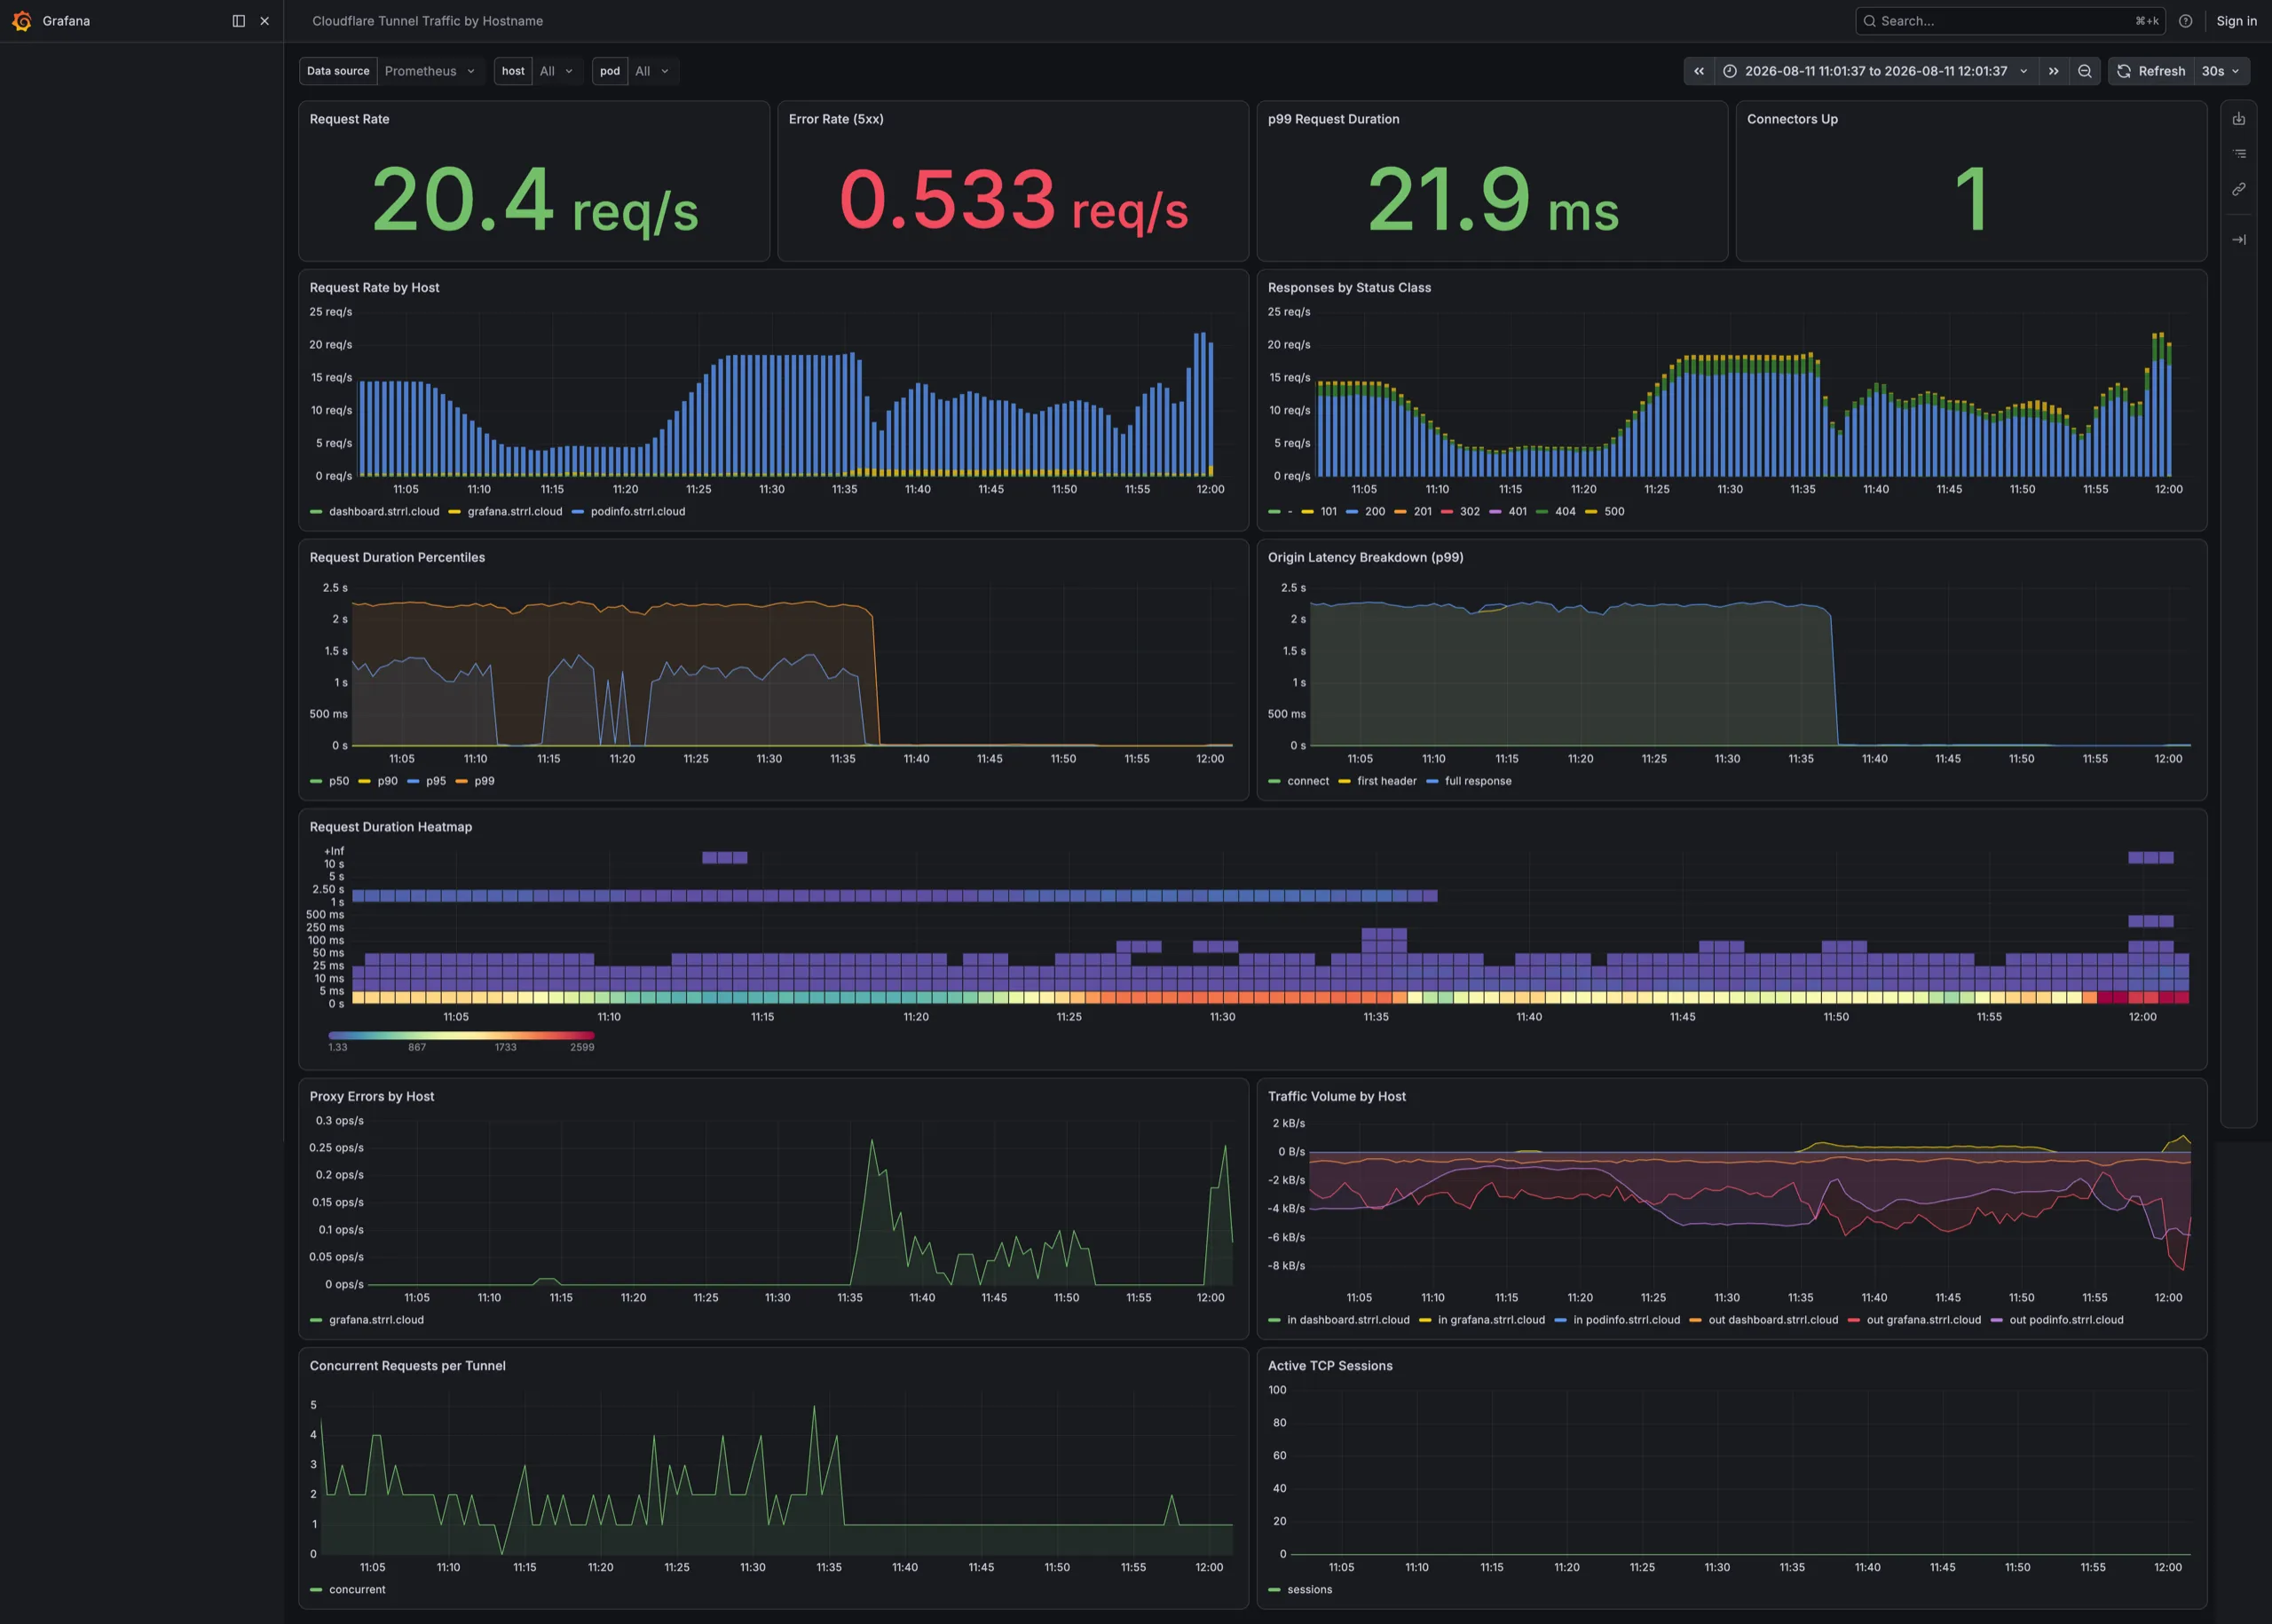
The controller and its managed cloudflared connectors expose separate metrics endpoints. With the ready made Grafana dashboards below, the collected metrics look like this:
See Helm values for chart defaults.
Inspect controller metrics
Section titled “Inspect controller metrics”The controller serves controller runtime metrics plus custom sync metrics over HTTP at /metrics on port 9090 (metrics.port). The chart always creates a metrics Service for this endpoint. When serviceMonitor.create is false, the Service carries prometheus.io/scrape annotations for annotation based discovery.
Forward the port from one controller pod:
kubectl port-forward deployment/cloudflare-tunnel-ingress-controller \ -n cloudflare-tunnel-ingress-controller \ 9090:9090Read the endpoint from another terminal:
curl http://127.0.0.1:9090/metricsInspect cloudflared metrics
Section titled “Inspect cloudflared metrics”Every managed cloudflared process listens on 0.0.0.0:44483. The chart always creates the controlled-cloudflared-connector-headless Service with a metrics port at 44483.
Forward that Service and read one connector:
kubectl port-forward service/controlled-cloudflared-connector-headless \ -n cloudflare-tunnel-ingress-controller \ 44483:44483curl http://127.0.0.1:44483/metricsWhen serviceMonitor.create is false, the Service carries prometheus.io/scrape: "true" and prometheus.io/port: "44483" annotations for annotation based discovery.
Create the ServiceMonitors
Section titled “Create the ServiceMonitors”Prometheus Operator must be installed before you enable these objects. One switch creates ServiceMonitors for both metrics endpoints: the controller and the managed cloudflared connectors. Add the following settings to the values file used by the existing release:
serviceMonitor: create: true labels: release: kube-prometheus-stack interval: 30s scrapeTimeout: 10s metricRelabelings: [] relabelings: [] cloudflared: jobLabel: app.kubernetes.io/component honorLabels: false scheme: httpAdjust each field for your Prometheus installation:
createrenders both ServiceMonitors.labelsadds metadata labels, commonly used by a Prometheus selector.intervalsets the scrape interval.scrapeTimeoutsets the timeout for one scrape.metricRelabelingsadds metric relabel rules after a scrape.relabelingsadds target relabel rules before a scrape.cloudflared.jobLabelnames the selected Service label used as the Prometheus job label for the connector target.cloudflared.honorLabelscontrols whether labels from scraped connector metrics take precedence.cloudflared.schemesets the scrape scheme for the connector target.
The generated ServiceMonitors select only the chart Services in the Helm release namespace and scrape their named metrics ports at /metrics.
Run your normal Helm upgrade, then verify the object:
kubectl get servicemonitor \ -n cloudflare-tunnel-ingress-controllerImport the Grafana dashboards
Section titled “Import the Grafana dashboards”The repository ships two ready to import Grafana dashboards in the
mixin/dist directory:
controller.jsonshows controller health: sync freshness, managed exposures, Cloudflare API errors, DNS record changes, and reconcile activity.cloudflared.jsonshows traffic per exposed hostname: request rate, status codes, latency percentiles, and traffic volume. These panels use the per hostname metrics from the defaultghcr.io/strrl/cloudflaredimage.
Import each file in Grafana with Dashboards -> New -> Import and select your Prometheus data source. Both metrics endpoints described above must be scraped for the panels to show data.
Both dashboards are also published on grafana.com, so you can import them by ID instead of uploading a file:
Add cloudflared health probes
Section titled “Add cloudflared health probes”The chart copies cloudflared.probes.liveness, readiness, and startup into the managed connector container as Kubernetes probe objects.
This example uses the cloudflared readiness endpoint on the metrics port:
cloudflared: probes: liveness: httpGet: path: /ready port: 44483 initialDelaySeconds: 10 readiness: httpGet: path: /ready port: 44483 startup: httpGet: path: /ready port: 44483 failureThreshold: 30 periodSeconds: 2Run your normal Helm upgrade, then inspect the managed Deployment and pods:
kubectl describe deployment controlled-cloudflared-connector \  -n cloudflare-tunnel-ingress-controller
kubectl get pods \  -n cloudflare-tunnel-ingress-controller \  -l app=controlled-cloudflared-connector